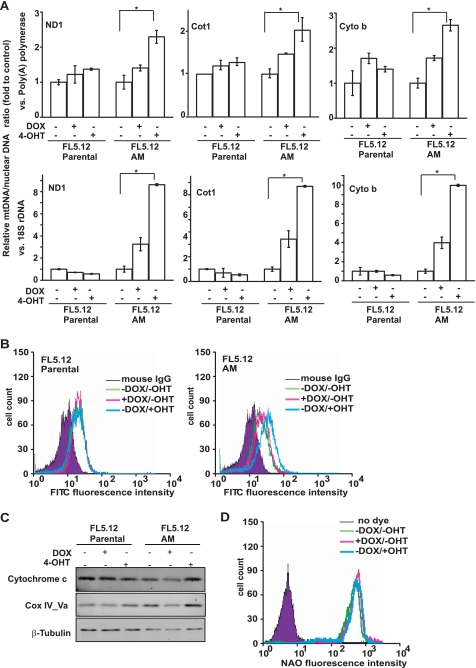
FIGURE 3.
Characterization of the effects of Akt and c-Myc on mitochondria. FL5.12 parental and FL5.12-AM cells were cultured with DOX or 4-OHT for 36 h. A, ratio of mitochondrial DNA to nuclear DNA was determined by quantitative real time PCR and normalized to that of uninduced cells. Three pairs of primers for mitochondrial DNA-encoded genes and two pairs of primers for nuclear DNA-encoded genes were used. ND1, NADH dehydrogenase-1; Cot1, cytochrome c oxidase subunit 1; Cyto b, cytochrome b. The experiments were repeated three times, and real time PCR was performed in duplicate for each reaction. Data shown are averages of three experiments ± S.D. (*, p < 0.05). B, cells were incubated with control IgG or anti-Cox IV subunit 1 and then incubated with fluorescein isothiocyanate-conjugated anti-mouse IgG secondary antibody. The expression level of mitochondrial complex IV subunit 1 was analyzed by flow cytometry. Note that the addition of 4-OHT increased the expression of complex IV subunit 1 in FL5.12-AM but not in the parental cells. C, immunoblotting analysis of the expression of nuclear DNA-encoded mitochondrial protein cytochrome c and Cox IV subunit Va. β-Tubulin was used for equal loading. D, mitochondrial mass was detected in FL5.12-AM cells with mitochondrial fluorescent dye acridine orange 10-nonyl bromide (NAO). The relative acridine orange 10-nonyl bromide intensity was analyzed by flow cytometry. No significant difference was detected between the uninduced and induced cells.

