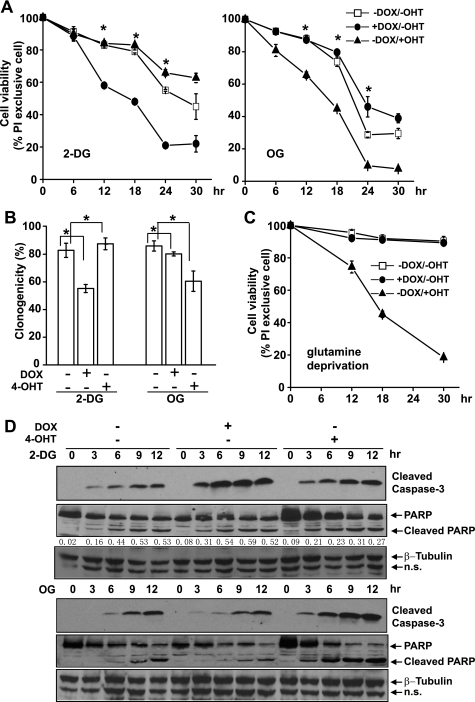
FIGURE 5.
Akt and c-Myc render cells differentially susceptible to the inhibition of glycolysis or mitochondrial function. Cells were cultured with DOX or 4-OHT to activate Akt or c-Myc for 36 h. A, cells were treated with 6 mm 2-DG or 1 μg/ml OG. Cell viability was measured by PI exclusion at indicated time points. Data are average of three experiments ± S.D. (*, p < 0.05). B, cells were treated with 2-DG or OG for 6 h and washed with fresh media without the inhibitors. 80 cells were placed in a 96-well plate and cultured for 14 days. Clonogenicity of the cells represents cell survival ability after 6 h of treatment with the metabolic inhibitors. Data are average of three experiments ± S.D. (*, p < 0.05). C, cells were cultured in glutamine-free media for the indicated time. Cell viability was measured by PI exclusion. Data are average of three experiments ± S.D. D, cell lysates were collected at the indicated time points, and immunoblotting was performed with antibodies against cleaved caspase-3, PARP, and β-tubulin. The ratio of cleaved PARP versus full-length PARP is indicated in cells treated with 2-DG. n.s., nonspecific bands.

