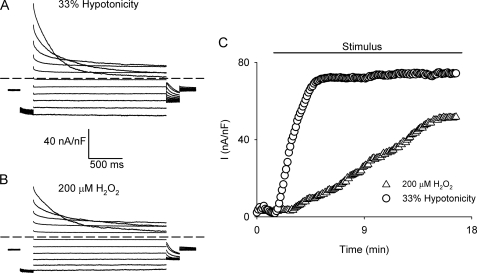
FIGURE 1.
Hypotonicity- and H2O2-evoked VSOR Cl− currents. Representative current traces of nystatin-perforated whole-cell currents activated by a voltage step protocol (2000 ms) from a holding potential of −30 mV ranging from −100 to 100 mV in 20 mV steps. The test pulse was preceded by a pulse to −100 mV (200 ms) and followed by a pulse to −60 mV (200 ms), for cells exposed to 33% hypotonic solution (A) or 200 μm H2O2 (B). C, representative experiment showing the time course of VSOR Cl− current development evoked by exposure to 33% hypotonicity (○) or 200 μm H2O2 in isotonicity (▵) in the presence of 2 mm external Ca2+. Currents were measured at 80 mV every 7 s and normalized to cell capacitance.

