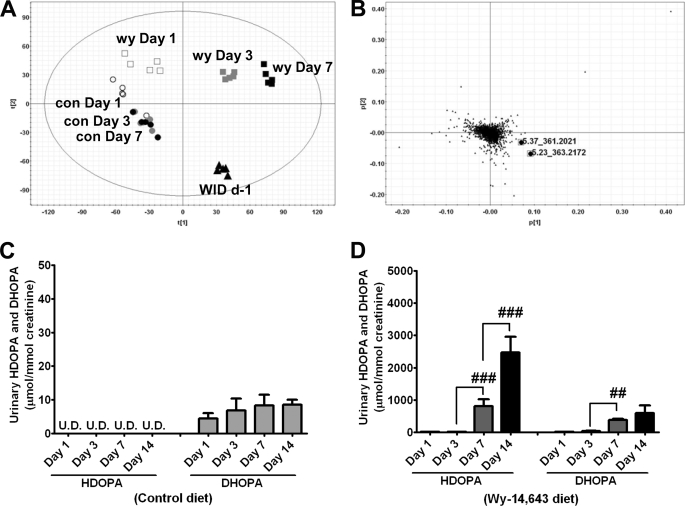
FIGURE 1.
Metabolomic analysis of mouse urine identifies HDOPA and 20α-DHOPA as time-dependent biomarkers of PPARα activation. A, PCA scores plot of component 1 versus component 2 for seven groups of urine samples from wild-type mice (C57BL/6Nr background), fed either control diet (con, ○) or Wy-14,643 diet (wy, □) at day 1 (white symbols), day 3 (gray symbols), day 7 (black symbols), and 1-day withdrawal from WY after 1 week of WY diet administration (WID d-1, ▴) (n = 5). B, PCA loading plot showing that HDOPA (m/z = 361.202+ at 5.37 min) and 20α-DHOPA (m/z = 363.217+ at 5.23 min) contributed to the separation between control and WY-fed groups (n = 5). Time course urinary levels of HDOPA and 20α-DHOPA in mice fed a control (C) or a WY (D) diet (n = 5). Each data bar in this figure represents the mean ± S.D. DHOPA, 20α-DHOPA; U.D., undetectable. The group differences are shown with significance values of p < 0.01 (##) and p < 0.001 (###) for one-way ANOVA.

