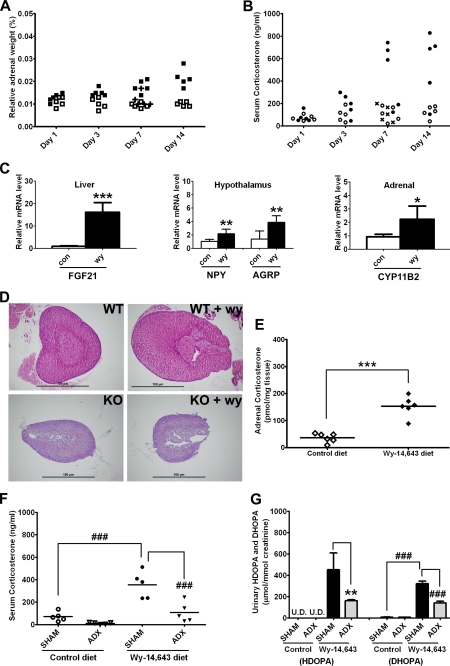
FIGURE 2.
Activation of HPA axis by PPARα ligands and the attenuation of HDOPA and 20α-DHOPA production by adrenalectomy. A, time course relative adrenal weight (percentage of body weight) of wild-type mice (C57BL/6Nr background) fed either control diet (□) or WY diet (■), or withdrawal from WY for 2 days (WID) after 1 week of WY diet administration (+), 0.013% (wy) versus 0.011% (con), p > 0.5 at day 1; 0.015% (wy) versus 0.010% (con), p < 0.01 at day 3; 0.018% (wy) versus 0.009% (con), p < 0.001 at 1-week; and 0.022% (wy) versus 0.010% (con), p < 0.001 at 2-weeks of WY treatment, 0.012% (WID) versus 0.018% (wy) at 1-week, p < 0.05 (n = 5). B, time course serum corticosterone level (ng/ml) of wild-type mice fed either control diet (○) or WY diet (●) or withdrawal from WY for 2 days after 1 week of WY diet administration (×), determined by ELISA kit, 79.8 (wy) versus 71.9 (con) ng/ml, p > 0.5 at day 1; 190.0 (wy) versus99.5 (con) ng/ml, p > 0.5 at day 3; 463.9 (wy) versus 108.0 (con) ng/ml, p < 0.05 at 1-week; and 543.8 (wy) versus 126.2 (con) ng/ml, p < 0.05 at 2-weeks of WY treatment, 111.0 ng/ml (WID) versus 463.9 (wy) ng/ml at 1-week, p < 0.05 (n = 5). C, relative mRNA levels of FGF21 in livers, NPY and AGRP in hypothalamus, and CYP11B2 in adrenal glands of wild-type mice fed control (white bars) or WY (black bars) diet for 2 weeks, determined by qPCR (n = 6). D, representative histology sections of adrenal glands from wild-type (WT) and Ppara-null (KO) mice (both C57BL/6Nr background) fed control or WY diet for 2 weeks (magnification, 40×). E, adrenal corticosterone levels (pmol/mg tissue) of wild-type mice fed control diet (◇) or WY diet (♦) for 2 weeks, determined by UPLC-TOFMS (n = 6). Adrenalectomy and the control sham surgery were performed on wild-type mice, and either control or WY diet was given to both groups 1 week after the surgery. Serum and urine samples were collected at day 7 of diet administration. F, serum corticosterone level (ng/ml) of SHAM and ADX mice fed control or WY diet, determined by ELISA kit (n = 5). G, urinary HDOPA and 20α-DHOPA levels (μmol/mmol creatinine) of SHAM and ADX mice fed control or WY diet, determined by UPLC-TOFMS (n = 5). Each data bar in this figure represents the mean ± S.D., and the data points are given as individuals or individuals with mean. DHOPA, 20α-DHOPA. The group differences are shown with significance values of p < 0.05 (*), p < 0.01 (**), and p < 0.001 (***) for Student's t test and p < 0.001 (###) for one-way ANOVA.

