FIGURE 2.
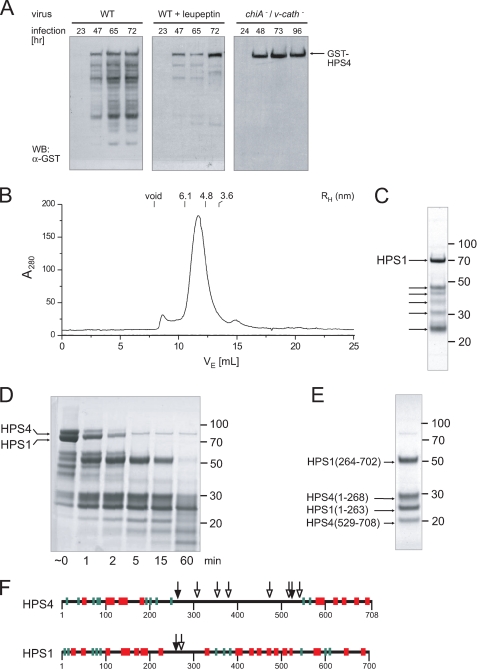
Protease sensitivity and mapping of disordered regions. A, Sf9 cells were infected with either wild-type or a cathepsin/chitinase (v-cath/chiA)-deficient baculovirus expressing GST-HPS4 and HPS1. Total cell lysates taken at the indicated time points after infection were analyzed by immunoblotting using an antibody to GST. B, gel filtration profile of recombinant BLOC-3 after autoproteolytic digestion. The hydrodynamic radii of standard proteins are indicated. C, Coomassie Blue-stained SDS-PAGE of the peak fraction from the gel filtration shown in B. In addition to full-length HPS1, several smaller HPS1 and HPS4 fragments remain tightly associated in the complex (arrows). D, limited proteolysis with trypsin. Full-length recombinant BLOC-3 was incubated with 2 μg/ml trypsin at room temperature and aliquots taken at the indicated time points. E, BLOC-3 was proteolysed with trypsin for 15 min and loaded onto a Superdex 200 gel filtration column. The four major bands in the 15-min digest (D) remain tightly associated and co-elute in the peak fraction. However, the central region in HPS4 between 268 and 529 dissociates from the rest of the complex and is not present in the peak fraction. The gels in C through E were stained with Coomassie Blue, molecular masses are indicated in kDa. F, all protease cleavage sites in BLOC-3 are located in regions lacking predicted secondary structure. Mapped sites from autoproteolysis (open arrowheads) and limited trypsin proteolysis (closed) are shown together with predicted secondary structure elements for HPS1 and HPS4 (α-helices, red; β-strands, green).

