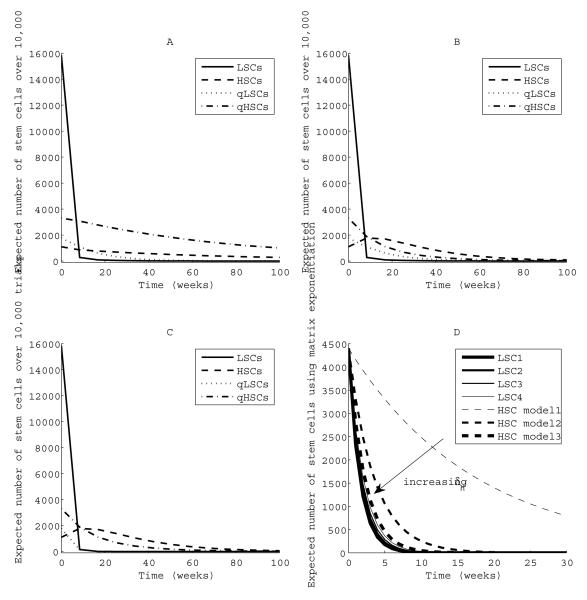
Fig. 4.
Effects of quiescence and heterogeneity of LSCs on population sizes during therapy. Panel A: ϕL = 0.007 << ϕH = 0.21, and νL = νH = 0.00024 week−1. The coefficient of variation of population size increases as stem cell counts approach very small numbers, with ranges from 0.17 to 1.2 for LSCs, 0.03 to 0.11 for HSCs, 0.04 to 0.44 for qLSCs, and 0.03 to 0.17 for qHSCs. Panel B: ϕL = ϕH = 0.007, and νL = νH = 0.00024 week−1. Panel C: ϕL = ϕH = 0.007, νL = 0.25, and νH = 0.00024 week−1. In panels A to C, δL = 0.59, δH = 0.08, βL = βH = 0.024, and αL = αH = 0.07 week−1. Panel D: Arrow represents increasing δH. In all cases, δ4 = 0.52, δ3 = 0.57, δ2 = 0.62, δ1 = 0.67. Model 1: δH = 0.08 week−1. Model 2: δH = 0.31 week−1. Model 3: δH = 0.48 week−1.

