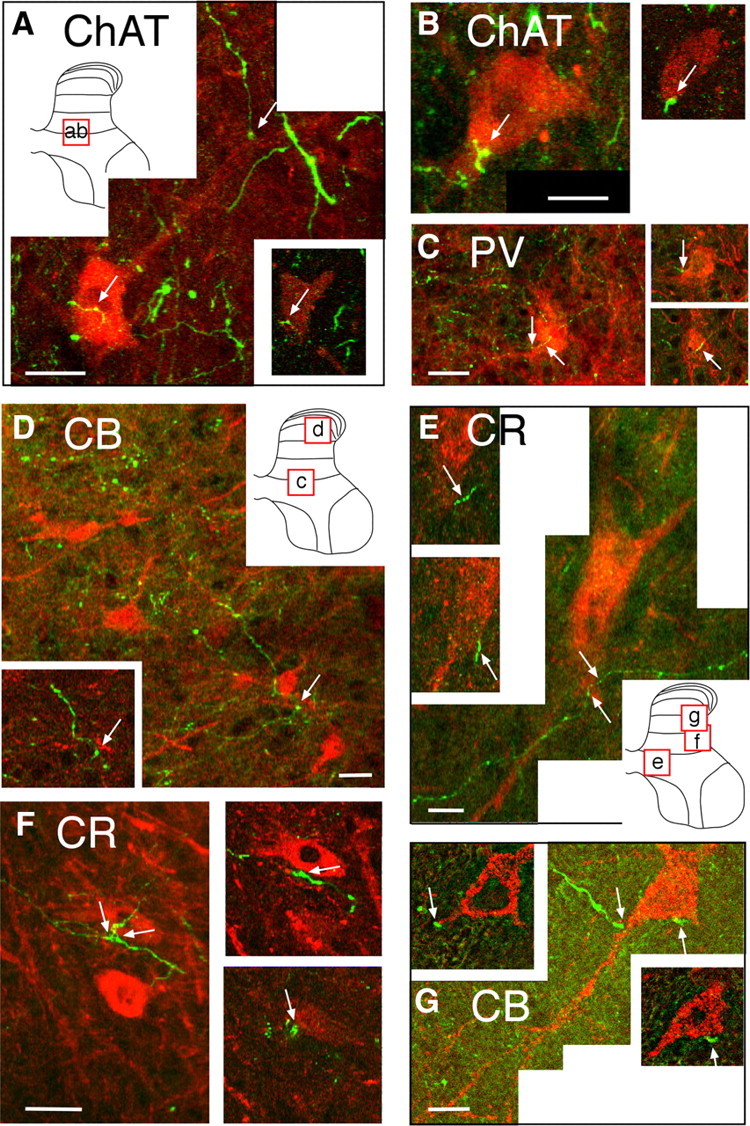
Figure 2.

Confocal micrographs showing contact between CST axon terminals and spinal interneurons. Each lettered part shows a projection image, and the micrograph insets present a single 1 μm optical slice. A, B, Two representative ChAT-positive interneurons (red) contacted by labeled CST axons (green). Arrows in A show two points of contact, one of which (on cell body) is shown on the 1 μm optical slice (inset, bottom right). Arrow on projection image in B points to a contact on the cell body. The inset is a 1 μm optical slice showing the same contact point. The locations of the projection images in A and B are shown in the schematic gray matter inset in A. C, PV-positive interneuron (red). The arrows on the projection image point to contact between a labeled CST axon and the cell body. The insets at the right show these contacts on two separate 1 μm optical sections at different z-axis depths. The location of the micrograph is shown in the inset in D. D, CB-positive interneurons (red). As in the other figures, the contact between the CST axons and an interneuron is marked by the arrow. A 1 μm optical slice through the contact is shown in the inset. The location of the cells is shown in the inset in D. E, F, CR-positive interneuron. The arrows on the projection image in E point to contact between a labeled CST axon and the cell body of one interneuron. The optical sections show the two marked contacts on the cell shown in the projection image. The projection image in F shows several contact points (arrows). The optical sections at the right are the contacts between the CST axons and the same calretinin-positive neuron. The contacts on this cell, as well as many others, are varicose portions of the axon, suggesting that they are boutons. The locations of the cells are shown in the inset in E. G, CB-positive interneuron from an animal that received unilateral M1 inactivation. Section taken from the side contralateral to inactivation (i.e., silenced or affected side of the spinal cord). Two points of contact are seen in the optical slices; only one of the contacts is shown on the projection image. G is a deconvolution image. The location of the cell is shown in the inset in E. Scale bars, 2 μm.
