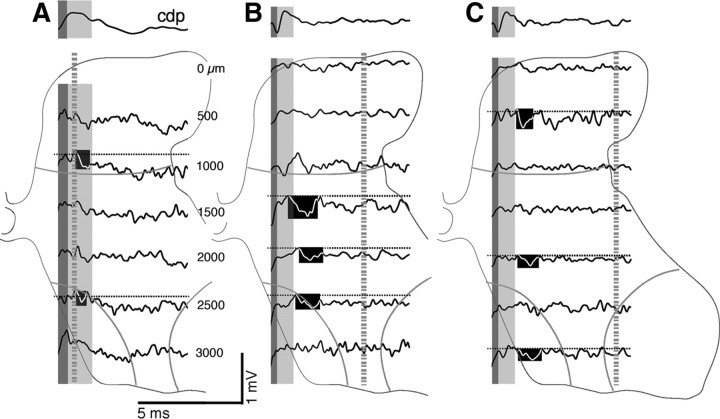
Figure 4.
Focal synaptic potentials at PW8. Same format as Figure 3A–C, with the CDP recordings above the depth recordings. The bottom two traces in each component correspond to ventral horn responses (i.e., at depths in which recording were made within or between laminae 8 and 9). The blackened regions highlight examples of small and large FSPs in the monosynaptic (beginning during the CDP postsynaptic response) and oligosynaptic ranges.

