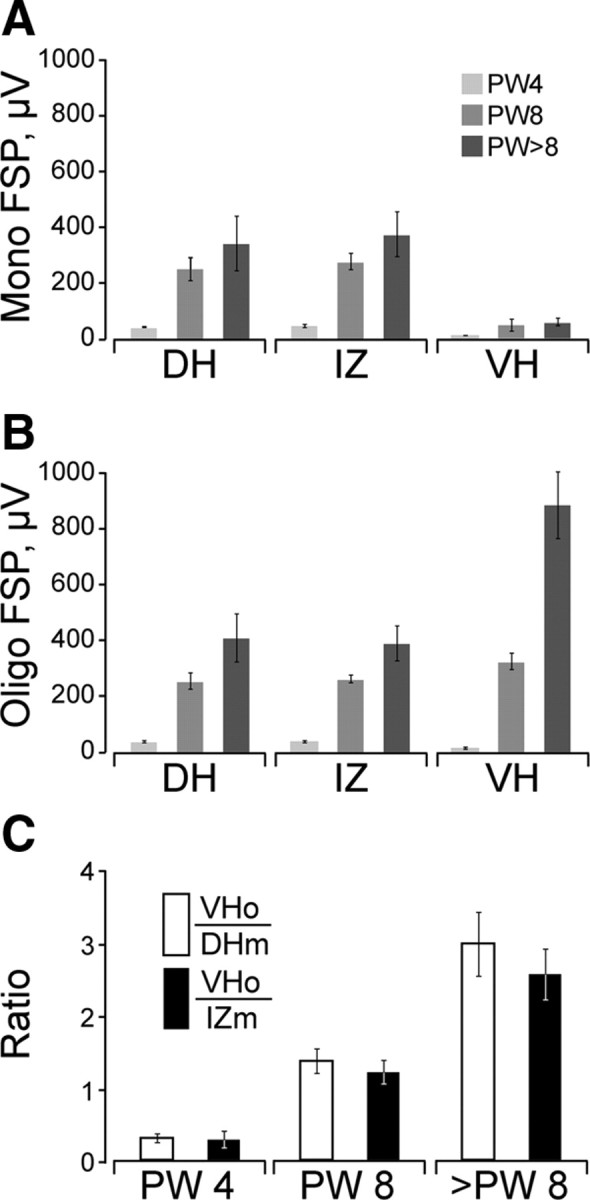
Figure 6.

A, B, Age-dependent changes in the amplitude of FSPs recorded in the monosynaptic (A) and oligosynaptic ranges (B). Data are from animals at PW4 (light gray; n = 4), PW8 (medium gray; n = 4), and PW11 (dark gray; n = 5). C plots the ratio of input signals to output. The white bars show the ratios based on dorsal horn monosynaptic-range inputs (white) and intermediate zone inputs (black). All bars plot mean ± SEM. Statistics are presented in Results. DH, Dorsal horn; IZ, intermediate zone; VH, ventral horn; o, oligosynaptic; m, monosynaptic.
