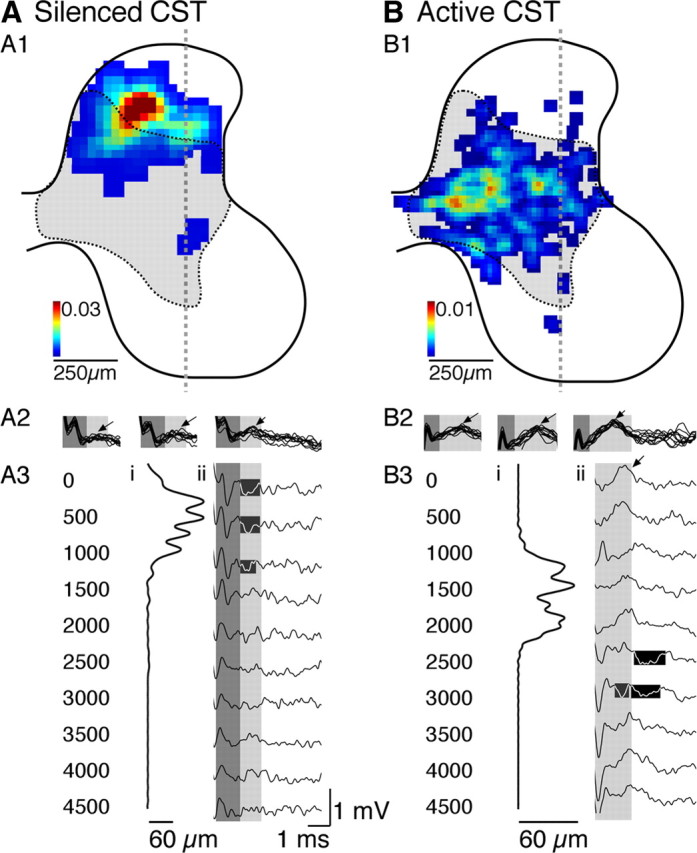
Figure 7.

Effect of unilateral inactivation on the distribution of contralateral CST terminations, CDPs, and FSPs from the silenced M1 (A) and the ipsilateral CST terminations, ipsilateral CDPs, and ipsilateral FSPs from the active M1 (B). All data on this figure are from the same animal and the same anatomical side of the cord but either contralateral to the previously silenced M1 (A) or ipsilateral to the initially active M1 (B). A1, B1, Color-coded density maps of CST axon terminations. The color calibration is between 0 and 0.03 (A1) or 0.01 (B1) μm axons/30 μm square regions. The dashed and shaded region corresponds to the normal contralateral CST termination field. A2, B2, CDP from sides of the cord shown in A1 and B1. A3, B3, Dorsoventral distribution of axonal labeling (A3i, B3i) and depth recordings (A3ii, B3ii; depths in micrometers at left). The dorsoventral distributions of axon density were computed from the density maps in A1 and B1. Each line plots the density of axon terminations of the animal, from the dorsal to the ventral borders of the gray mater. Samples were interpolated to 1000 points between the dorsal and ventral margins of the gray matter. Scales are in micrometers of CST axon length within each sequential slice of gray matter. Depth recordings, also from sides of the cord shown in A1 and B1, in response to the third stimulus only. The first two stimuli did not evoke consisting responses. The highlighted areas mark dorsal focal negativities (A3ii) and focal negativities in the intermediate zone (B3ii).
