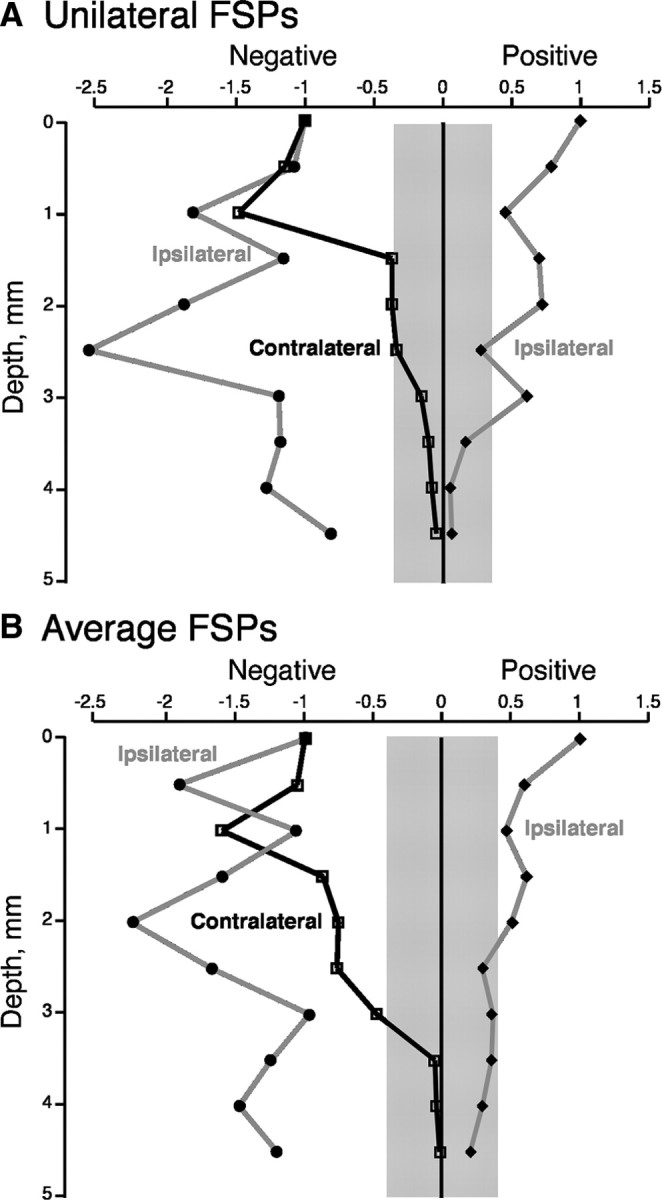
Figure 8.

Graphs showing the negative (left) and positive (right) potentials recorded in animals subjected to unilateral M1 inactivation. All recordings are from the same anatomical side of the spinal cord. Black line plots the negativity recorded contralaterally, in response to stimulation of the PT on the initially silenced side. The gray lines plot positive and negative potentials recorded ipsilaterally, in response to stimulation of the PT on the initially active side. A is a plot of values from the middle electrode penetration in one animal, and B is a plot of the mean of values obtained from three animals (includes the animal shown in A). The gray band straddling 0 indicates the mean level of random noise recorded along the electrode penetration in A and the mean of the values recorded in three cases in B.
