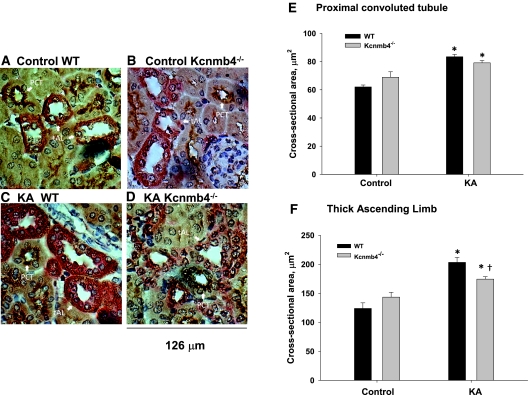
Figure 8.
Kcnmb4−/− TAL tubules, but not PCT, have blunted distention during KA. Representative sections from (A) control WT, (B) control Kcnmb4−/−, (C) KA WT, and (D) KA Kcnmb4−/− illustrating the luminal cross-sectional areas of CCD. Bar plots summarizing the (E) PCT and (F) TAL luminal cross-sectional areas for each treatment group. * = significant difference (P < 0.05) between diets. † = significant difference between phenotypes on same diet.

