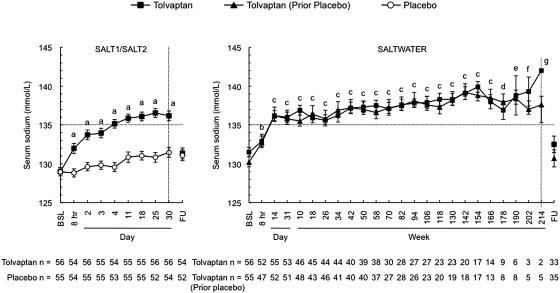
Figure 2.
Serum sodium levels obtained in the course of the SALT-1, SALT-2 and SALTWATER trials. Rate of correction of serum sodium levels and the plateaus reached afterwards were similar in both studies. The left-hand figure includes only patients in the SALT-1 and SALT-2 who continued into SALTWATER. Error bars are ± SE. BSL, baseline; FU, follow-up visit 7 days after early withdrawal or trial completion. aP < 0.001, tolvaptan versus placebo; bP ≤ 0.0011, tolvaptan and tolvaptan (before placebo) versus baseline; cP < 0.001, tolvaptan and tolvaptan (before placebo) versus baseline; dP = 0.021, tolvaptan versus baseline and P < 0.001 tolvaptan (before placebo) versus baseline; eP < 0.001, tolvaptan (before placebo) versus baseline; fP = 0.005, tolvaptan (before placebo) versus baseline; gP = 0.016 tolvaptan (before placebo) versus baseline.

