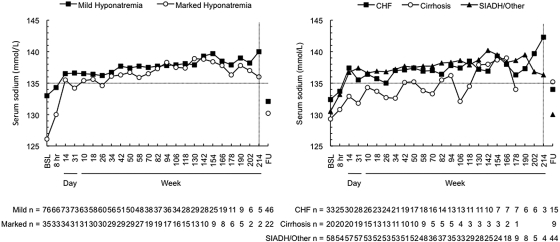
Figure 3.
Serum sodium measured according to severity of hyponatremia (left) and underlying cause (right). The correction rate had similar kinetics for all groups, except a steeper initial response for the marked hyponatremia subgroup (left). Comparisons versus baseline were statistically significant (P < 0.05) for patients with mild hyponatremia at all time points but week 214 and the follow-up visit; for patients with marked hyponatremia at all visits but weeks 202 and 214; for patients with CHF at all time points but weeks 190, 202, and 214 and the follow-up visit; for patients with cirrhosis at 8 hours, day 31, weeks 10, 18, and 50, and the follow-up visit; and for patients with SIADH/other at all visits but week 214 and the follow-up visit.

