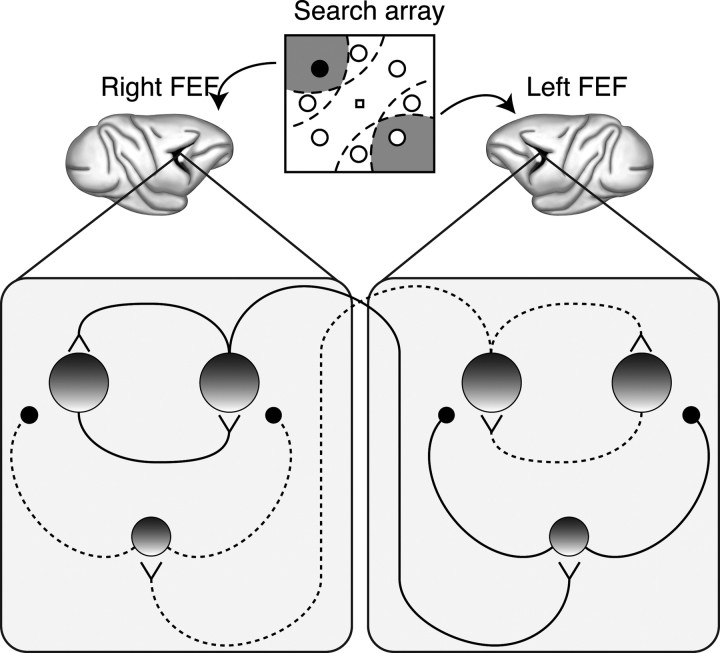
Figure 12.
Circuit illustrating interactions among FEF neurons representing the target (in the left visual field, represented by right FEF) and distractors during visual search. Large shaded circles represent excitatory neurons. Small shaded circles represent inhibitory interneurons. V-shaped symbols represent excitatory synapses. Small black circles represent inhibitory synapses. Solid lines represent strong connections. Dotted lines represent weak connections. Dashed lines in the search array represent the RFs of the pair of excitatory neurons in each FEF.

