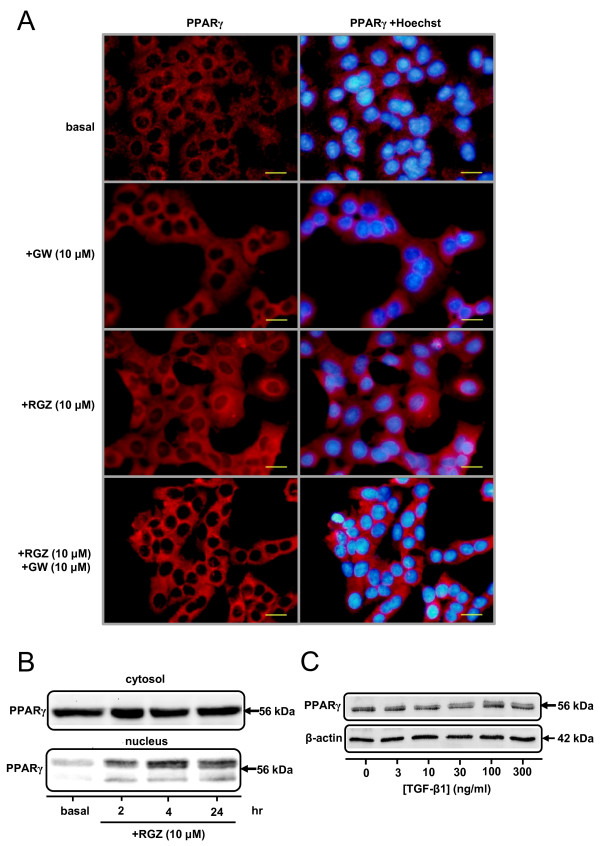
Figure 1.
PPARγ expression and localization in A549 cells. (A) Immunocytochemistry for PPARγ in A549 cells. Cells were grown to confluence on chamber slides, serum deprived for 24 hr and then treated with either vehicle (0.1% DMSO, left) for basal, 10 μM GW9662, 10 μM RGZ or 10 μM RGZ + 10 μM GW9662 for 24 hr. PPARγ localization in the cells was detected by immunocytochemistry (left column) and the nuclei visualised by Hoechst staining (right column). (B) Western blot for PPARγ expression in the cytosol and nuclei of serum-deprived A549 cells in the absence and presence of RGZ (10 μM) for 2 to 24 hr. Basal levels were measured at 2 hr after vehicle (0.1% DMSO) treatment. (C) Western blot for PPARγ expression in A549 cells in the absence and presence of TGF-β1 (72 hrs). All images and blots are representative of 3 separate experiments. In the ICC images bar = 100 μm.

