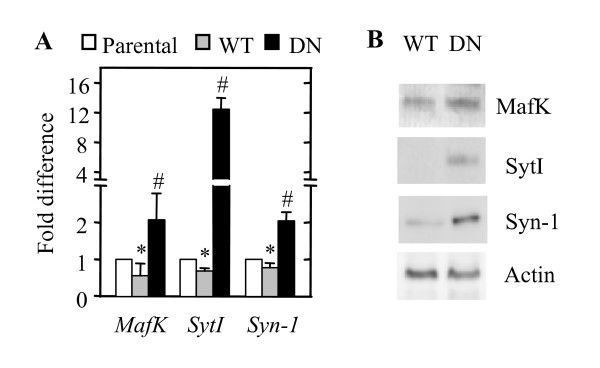
Figure 2.
Analyses of MafK, SytI, and Syn-1 mRNA levels in parental, WT-Akt-expressing, and DN-Akt-expressing PC12 cells. (A) Quantitative RT-PCR. mRNA level of the gene in each group of cells was normalized to the level of GAPDH mRNA and the transcript level of each gene in PC12 (WT-Akt) and PC12 (DN-Akt) cells is presented as a fold change from that of the PC12 (parental) cells. Parental, PC12 (parental) cells. *P < 0.05 (parental vs. WT). *P < 0.05 (parental vs. DN). n = 3-4, mean + SD. (B) Western blot analysis of SytI and Syn-1 protein levels in PC12 (WT-Akt) and PC12 (DN-Akt) cells.

