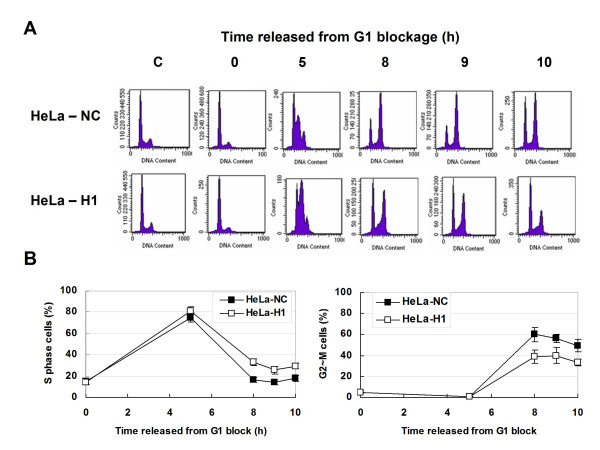
Figure 3.
Cell cycle progression of the synchronized DNA-PKcs-depressed HeLa-H1 cells and control HeLa-NC. A: Representative histograms of flow cytometry analysis. The cells synchronized in G1 phase by TdR double-blocking. G1 arrested cells were cultured in fresh DMEM, collected at 0, 5, 8, 9, 10 h after released from G1 block, analyzed by flow cytometry. B: Quantitative data of the cell cycle distribution of the cells released from G1 blockage by TdR double-blocking. Left panel, the proportion of S-phase cells at different times after released from G1 block. Right panel, the proportion of G2/M-phase cells at different times after cell cycle re-entry.

