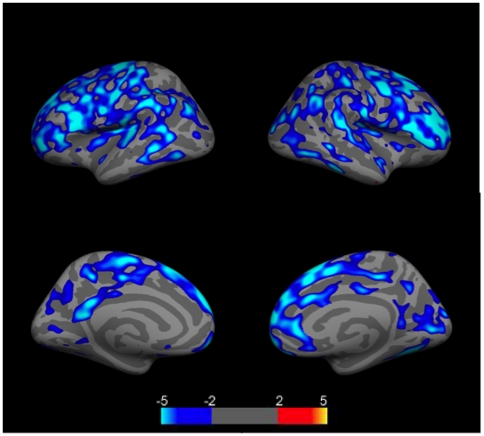
Figure 1. Group comparison of cortical thickness relationships to age for the entire group of NPSLE, SLE, and control subjects (N = 58).
Images show clusters of lower (blue clusters) cortical thickness values related to age. Clusters are displayed in the range of p≤.01 to p≤.0001 (color scale shows −log (10) p-value). Top left = left lateral hemisphere; Bottom left = left medial hemisphere; Top right = right lateral hemisphere; Bottom right = right medial hemisphere. Light blue regions indicate regions where age and cortical thickness were significantly related (p<.05) corrected for multiple comparisons (FDR).

