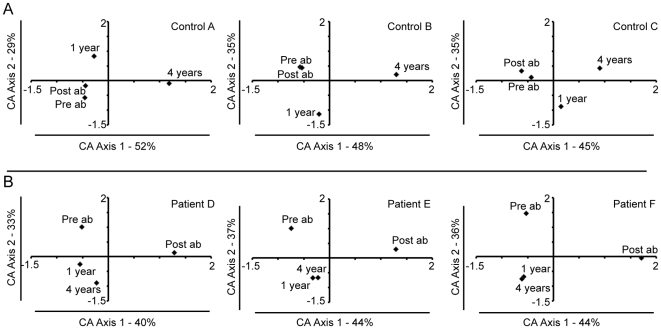
Figure 6. Correspondence analysis of the bacterial community found in fecal samples.
Each correspondence analysis plot represents the relative abundance values for the OTUs from the 16S rRNA pyrosequencing at day 0, day 8–13, 1 and 4 years. A: Controls; A, B, and C. B: Antibiotic treated patients; D, E, and F. Percentages of inter-sample variation explained, by the two axes are shown in the figures. In controls A–C and patients D–F the third axis represented 19%, 17%, 20%, 26%, 20%, and 20% of the variation.

