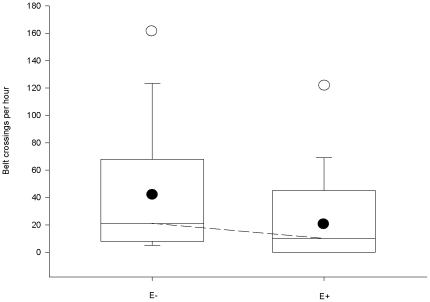
Figure 1. Mobility of voles.
Differences in mobility of sibling voles as defined by numbers of belt crossings per hour for voles fed on endophyte infected (E+) or endophyte free (E−) grasses. The upper and lower boundaries of the box indicate the upper and lower quartiles, respectively. The horizontal line denotes the median. Vertical bars represent the tails of the distribution. Medians of the groups are connected with dotted line. Filled circles represent mean values. Mild outliers are marked with open circles. The number of replicates is 24.

