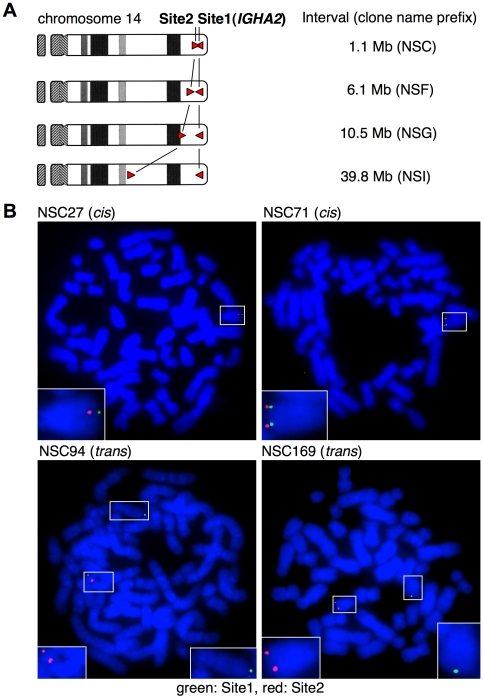
Figure 5. Site1 and Site2 integration for assessment of proximity between loci.
A, Scheme of chromosome 14 after cis targeting with the indicated Site1–Site2 intervals. B, FISH analyses of representative two cis-targeted (NSC27 and NSC71) and two trans-targeted clones (NSC94 and NSC169) are shown. The chromosomes 14 with Site1 and Site2 integration harbor green and red signals, respectively, and are highlighted with boxes, magnifications of which are shown in insets.

