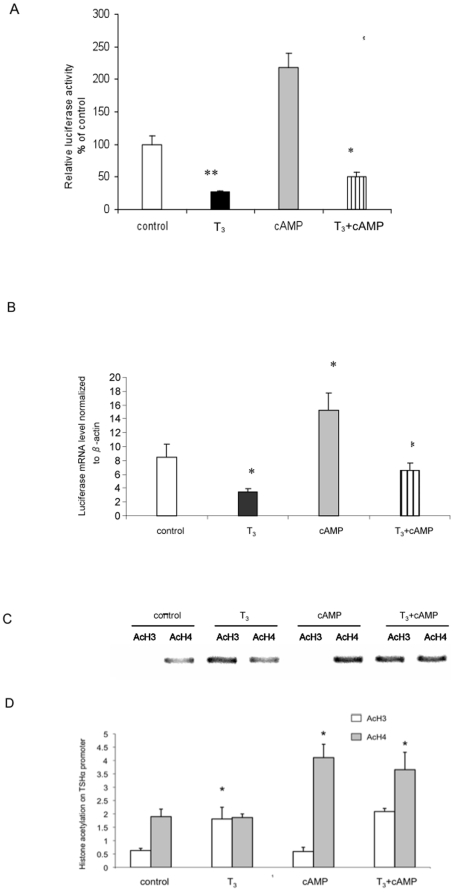
Figure 2. T3 and cAMP regulation of TSHα promoter activity and histone acetylation.
A) T3 and cAMP regulation of TSHα promoter activity. α-23 cells were treated 24 hours with no hormone/cAMP (control), 0.1 µM T3, 1 mM dbcAMP, or both. The cell lysates were prepared and luciferase activities were measured as described in Materials and Methods. B) Acute T3 and cAMP regulation of TSHα promoter activity. Luciferase mRNA expression was analyzed by RT-PCR in cells treated for one hour with no hormone/cAMP (control), 0.1 µM T3, 1 mM dbcAMP, or both. β-actin gene expression was used for normalization. Shown in A and B are the mean of triplicate samples ± SD. normalized to control as 100%. Similar findings were found in two other experiments. **, p<0.05; *, p<0.01 difference from control using ANOVA analyses. C) T3 and cAMP regulation of histone H3 and H4 acetylation. ChIP assay was performed as described in Materials and Methods using antibodies against acetylated H3 or H4. Similar findings were observed in two other experiments. Note: “- ” indicates no hormone or cAMP treatment. D) Quantitative RT-PCR analyses of PCR products from three separate ChIP experiments. The statistical analysis was performed utilizing ANOVA. Values are expressed as the mean ± SD. *, P<0.05 difference from control.

