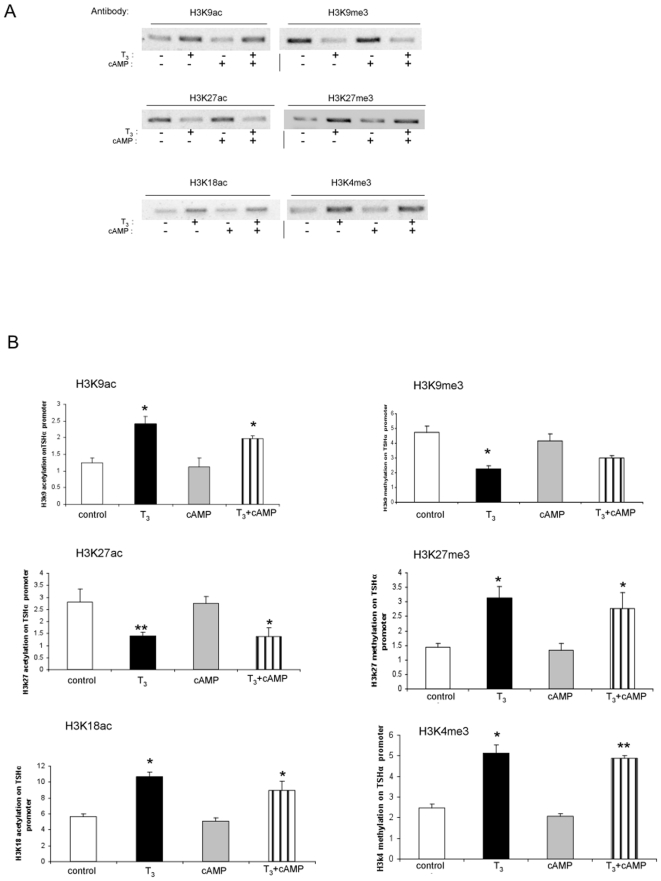
Figure 4. Specific histone H3 modifications on TSHα promoter with cAMP and T3 treatment.
α-23 cells were treated for one hour with no hormone/cAMP, 0.1 µM T3, 1mM cAMP or both before harvest and ChIP assay. A) Specific histone H3 modifications. Shown are bands from gel electrophoresis of PCR products from ChIP assay using indicated anti-acetylated and anti-methylated H3 antibodies as indicated in the Figure. Similar findings were observed in two other experiments. B) Quantitative RT-PCR analyses of PCR products from three separate ChIP experiments using same antibodies as in Figure 4A (n = 3). Statistical analyses performed as in Figure 1. *, p<0.05.

