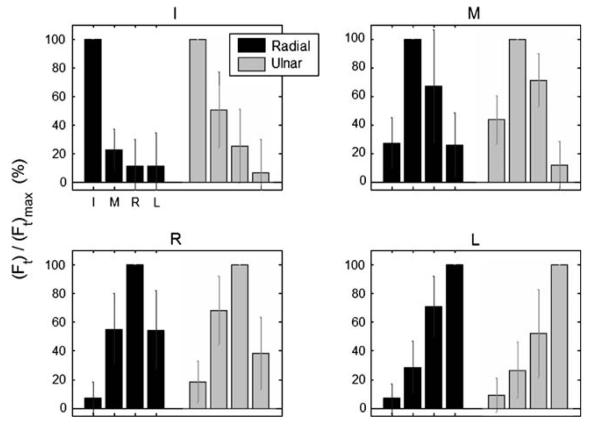
Fig. 3.
Force enslaving for the single-finger radial and ulnar deviation tasks (dark and light bars, respectively). The four sub-panels represent the four different single-finger tasks (I index, M middle, R ring, L little). Forces are presented as a percentage of each fingers' (Ft)max. Although enslaving for the master finger is, by definition, zero, it is presented above as 100% for a visual reference. Error bars represent standard deviations across subjects. Note the substantial enslaving, especially for the R finger and for the R task (i.e., when R was the master finger). Neighboring fingers to the master finger tended to be most enslaved

