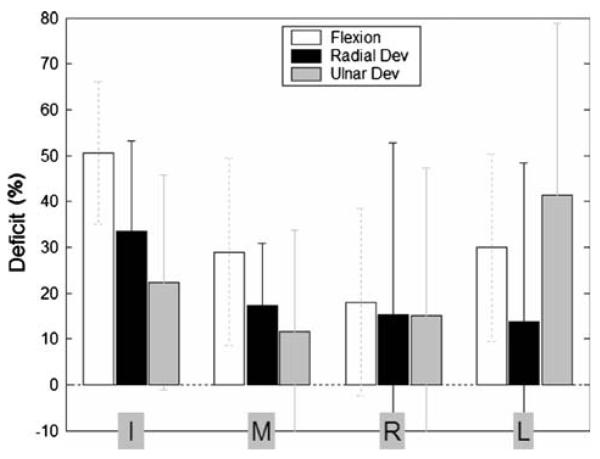
Fig. 6.
Force deficit for the four-finger tasks. Flexion, radial deviation, and ulnar deviation tasks are indicated by white, black, and gray bars, respectively, and are grouped by fingers. Deficit is expressed as a percentage of the individual fingers' MVCs. Negative deficit values indicate force ‘facilitation’ (see text). Error bars represent standard deviations across all subjects

