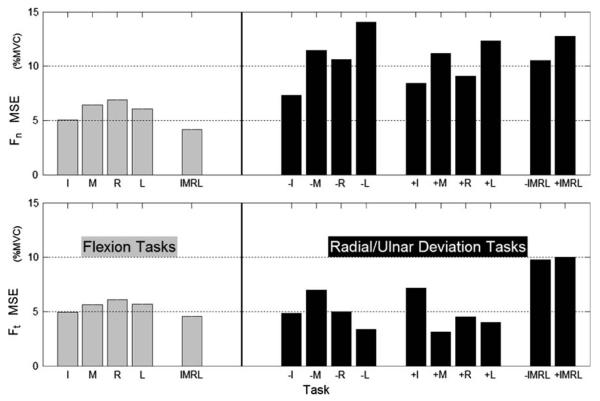
Fig. 7.
Network performance, expressed as mean square error (MSE). Flexion tasks are presented in the left panels and radial/ulnar deviation tasks in the right panels. The performances for normal (Fn) and tangential forces (Ft) are presented separately in the top and bottom panels. For each task instructed and non-instructed finger data are pooled. The ‘−’ and ‘+’ signs refer to radial and ulnar deviation, respectively

