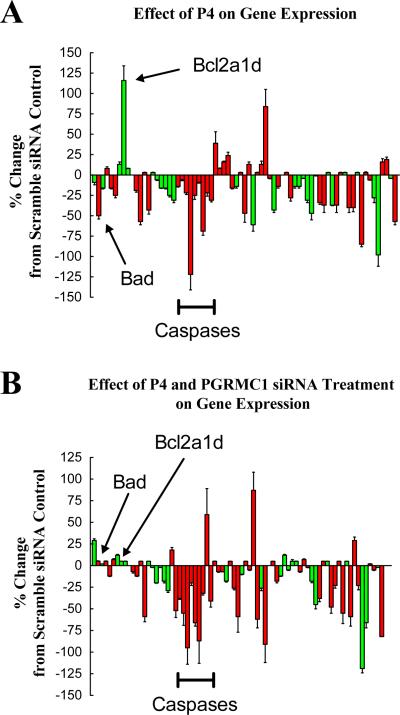
Figure 8.
The effects of 1μM P4 plus scramble siRNA (A) or 1μM P4 plus PGRMC1 siRNA treatment (B) on the expression profile of various apoptosis-related genes. The mRNA levels of apoptosis-related genes were assessed by real-time PCR and shown as a percentage change from scramble siRNA control values. The values are means (± standard error) of three experiments. Genes associated with the induction of apoptosis are shown in red and the anti-apoptotic genes shown in green.

