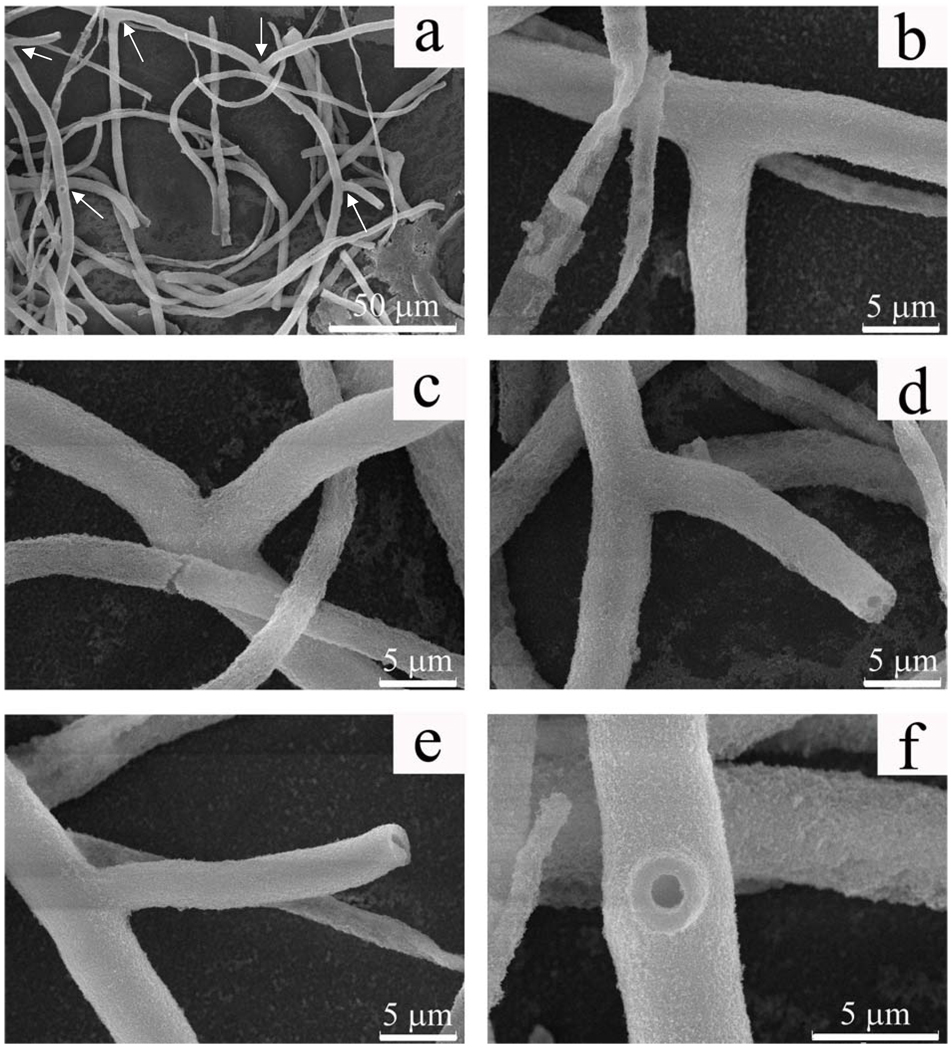
Figure 4.
SEM images of individual silica fibers separated from the samples shown in Figure 3 by sonication. a) low magnification image showing two branched fibers; b–d) higher magnification of three branches of the fiber in upper center of image shown in a; e, f) higher magnification of two branches of the fiber on the left side of image shown in a. Branches are indicated by arrows in image a.

