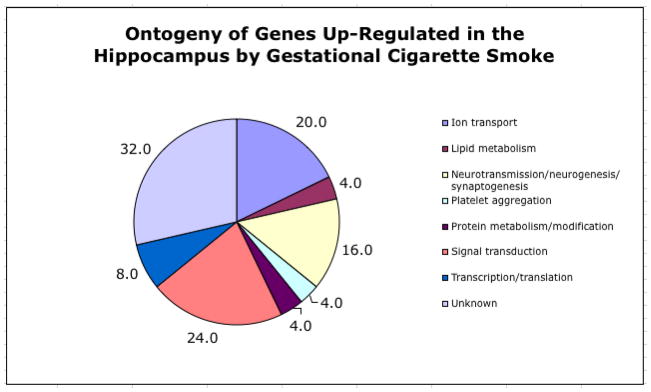
Figure 3.
Ontogeny of up-regulated genes in the hippocampus following exposure to ETS. The pie chart depicts the predicted function of genes that demonstrated an increase in expression in the hippocampus following ETS exposure. Numbers beside each pie segment indicate the percentage of the total number of upregulated genes assigned to a given functional category. Functional gene category assignments were determined through an extensive literature search in PubMed. Note that individual genes may be present in more than one category.

