
Fig. 1.
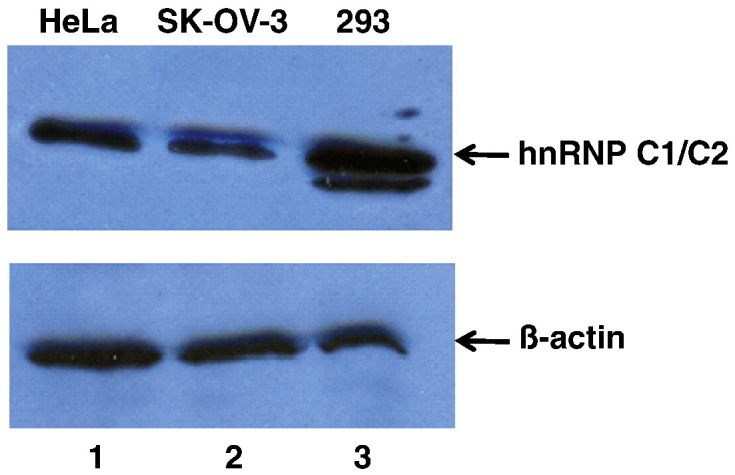
Western blot analysis of hnRNP C protein levels in three different cell lines. Protein samples from whole cell extracts generated from HeLa cells (lane 1), SK-OV-3 cells (lane 2), or 293 cells (lane 3) were subjected to SDS-polyacrylamide gel electrophoresis. Proteins were then transferred to a PVDF membrane by electro-blotting and probed with a monoclonal antibody to hnRNP C1/C2 (top panel) or β-actin (bottom panel) and then a secondary anti-mouse antibody conjugated to horseradish peroxidase (HRP). Due to the abundance of hnRNP C1/C2 in cells and differential antibody sensitivities, less total protein was loaded (10 µg) for hnRNP C1/C2 detection than for β-actin. To detect β-actin as the loading/transfer control, 50 µg of total protein from whole cell extracts was loaded on adjacent lanes of the gel prior to electrophoresis. All samples were loaded and subjected to electrophoresis on the same gel. After electro-blotting, the PVDF membrane was cut into two sections for separate protein detection with the two different monoclonal antibodies. A chemiluminescence substrate (Pierce) was utilized to develop the protein bands detected by antibodies. Band intensities were quantitated using Quantity One software (Bio-Rad).