. Author manuscript; available in PMC: 2011 May 14.
Published in final edited form as: Mol Cell Endocrinol. 2010 Feb 17;320(1-2):76–86. doi: 10.1016/j.mce.2010.02.014

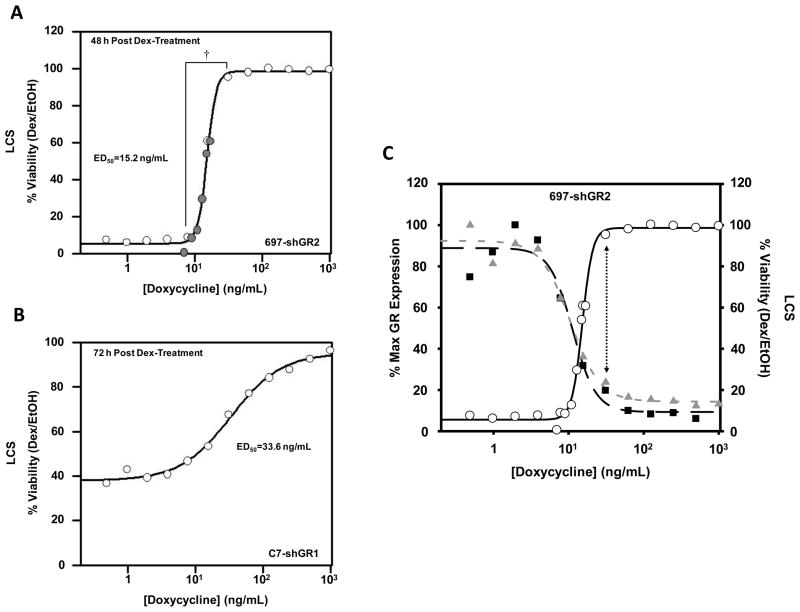
Figure 5.

Figure 5

The biological response to Dex shifts between a narrow range of functional GR levels in 697 cells. A) LCS values at 48 hours post-Dex treatment in 697-shGR2 cells are plotted versus the Doxy concentrations (48 hour pre-treatment prior to Dex). Following the initial experiment using the full 2-fold Doxy serial dilution (open circles), a second experiment was completed with a finer Doxy titration from 7 ng/mL to 17 ng/mL (gray circles). B) LCS values at 72 hours post-Dex-treatment in C7-shGR1 cells pre-treated with 2-fold dilutions of Doxy for 48 hours. LCS values were calculated from a flow cytometric apoptosis analysis using the Vybrant® Apoptosis Assay Kit #4. The curve fits are theoretical calculations via the following equation:
y=(Range1+(xED50)s)+Background

C) Compilation of the 697 cell data. Cell viability (open circles) and Dex-induced GR transcript (gray triangles) and protein expression (black squares) are plotted versus the pre-treatment Doxy concentration used in the experiment with 697-shGR2 cells. Expression levels of GR transcripts and protein shown are plotted as the calculated percentages of the maximum Dex-induced expression values from QRT-PCR (transcripts) and densitometery (protein) performed on the western blot shown in Figure 4. The vertical dotted arrow indicates that a GR expression level above ~20–25% is required for triggering some degree of GC-mediated apoptosis in these cells. The curve fits are theoretical calculations via the same equation used in Figure 5A. The calculated Doxy ED50 values for GR transcripts, GR protein, and cell viability are 10.5 ng/mL, 11.3 ng/mL, and 15.2 ng/mL, respectively.