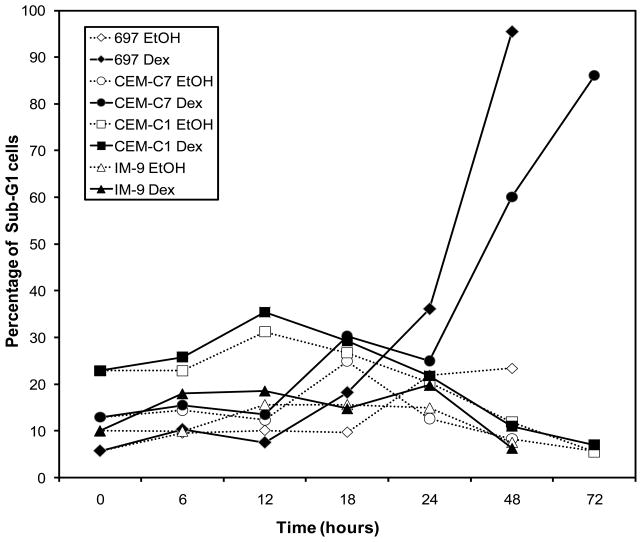
Figure 7.
Cell cycle analysis of cell lines. Cells were treated for the indicated times with either 1 μM Dex or an equal volume of the EtOH vehicle. After staining with propidium iodide, cell cycle analysis was performed to analyze the DNA content in individual cells. The percentage of sub-G1 cells as compared to the total number of cells analyzed for each sample is shown.

