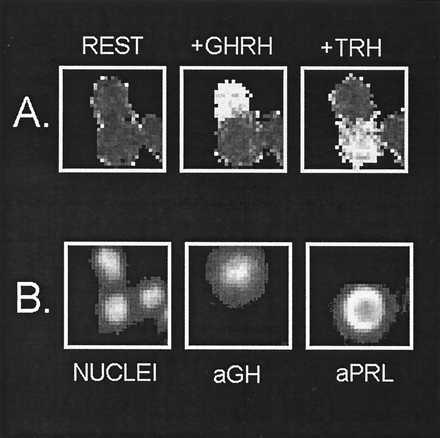
Figure 2.

Protocol for combining calcium imaging with immunocytochemical identification of the cell studied. A single microscopic field (30 × 30 μm) containing three single AP cells is shown. (A) Images were captured during the measurement of [Ca2+]i, either before stimulation (REST) or during stimulation with either 4 nM GHRH or 100 nM TRH. Higher [Ca2+]i appears brighter in the gray image. (B) Images were taken during the immunocytochemical identification protocol, after staining with anti-GH-Oregon green (aGH) or after staining with anti-PRL-Oregon green (aPRL). NUCLEI, nuclear localization after staining with Hoescht 33258. See Materials and Methods for details.
