
Figure 6.
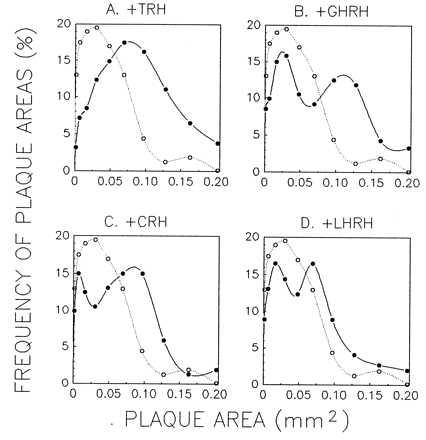
Effects of HRHs on frequency distribution of plaque areas. The sizes of plaques were quantified after a 2-hr antibody incubation with the different HRHs (100 nM). The frequency distributions for control, unstimulated cells (open circles and dotted line) and cells challenged with one of the four HRHs (closed circles and continuous line) are compared. Averages of three replicates within a single experiment are shown. Profiles are representative of results obtained in four similar experiments.