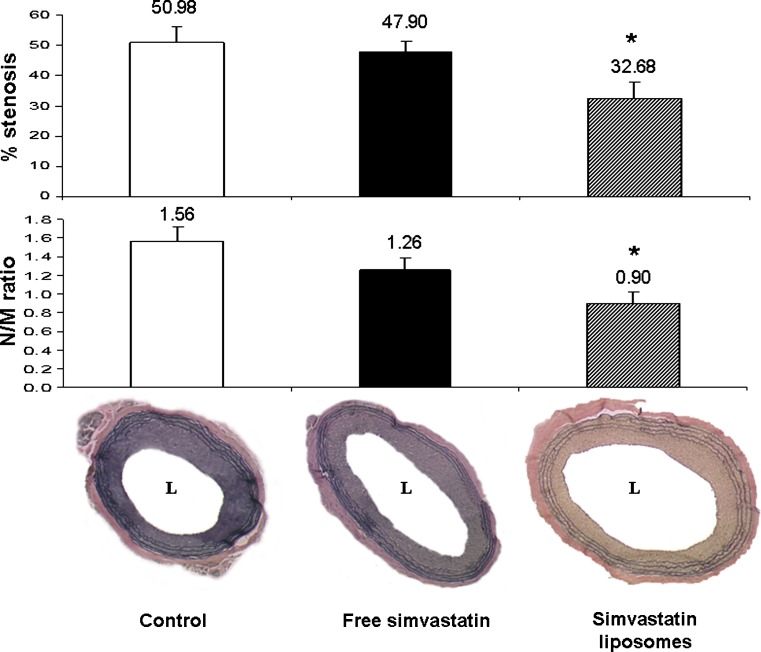
Fig. 2.
Bar graph depicting reduced stenosis (upper) and neointima/media (N/M) ratio (lower) in liposomal simvastatin treated rats (3 mg/kg, IV, n = 9) 14 days after injury, in comparison to treatments with simvastatin solution (3 mg/kg, IV, n = 9, free drug) and saline (IV, n = 9, control). Below the bar graph are photomicrographs of Verhoeff’s tissue elastin staining of full size sections of control, free simvastatin, and liposomal-simvastatin-treated animals (*p < 0.05)

