Fig. 1.
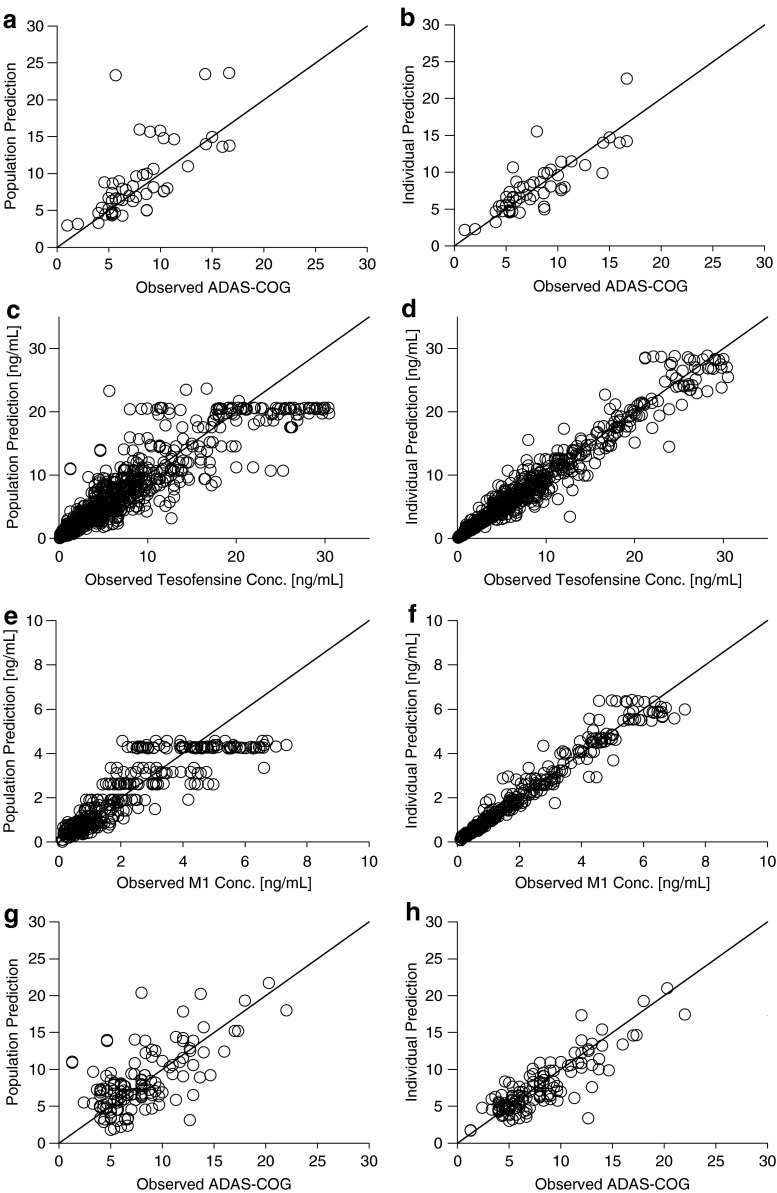
Goodness-of-fit plots for the final PK/PD model: population predictions (left panel) and individual predictions (right panel) versus ADAS-Cog measurements of placebo (a, b) and active treatment (g, h) and versus observed plasma concentrations of tesofensine (c, d), and M1 (e, f). Solid line indicates line of identity

