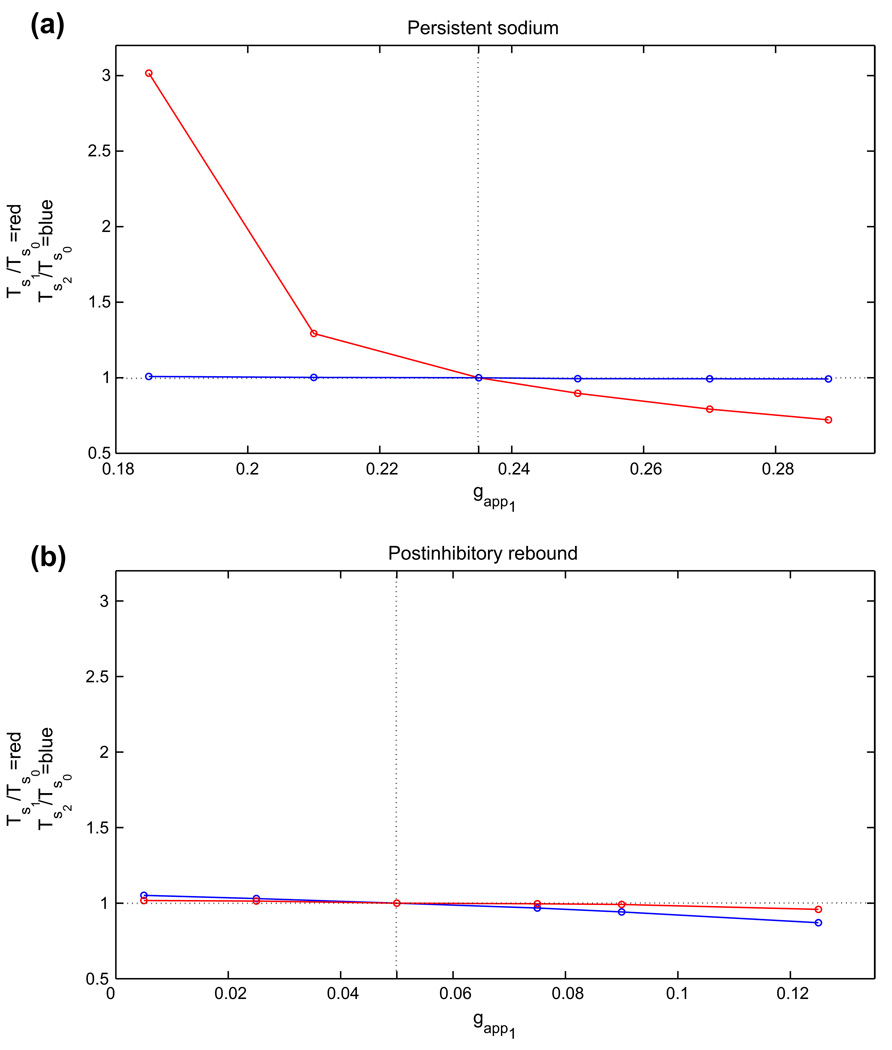
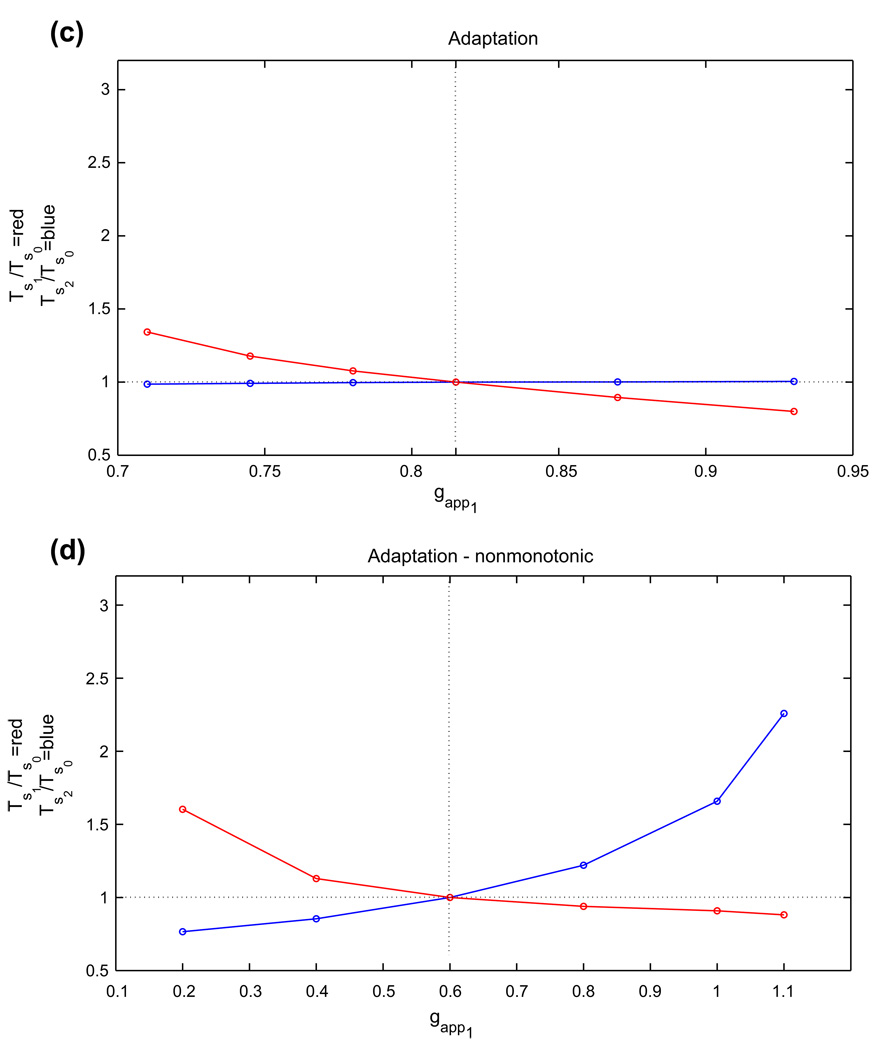
Fig. 6.
Changes in silent phase durations with changes in gapp1, the drive to cell 1. In each plot, gapp2 was held fixed at gapp0, the baseline drive for the corresponding model (dotted vertical line), and gapp1 was varied above and below that level. TS1 and Ts2 denote the resulting silent phase durations of cells 1 and 2, respectively, and Ts0 denotes the silent phase duration with gapp1 = gapp2 = gapp0. Half-center oscillations based on (a) persistent sodium, (b) postinhibitory rebound, and (c) adaptation, case 1, (d) adaptation, case 2


