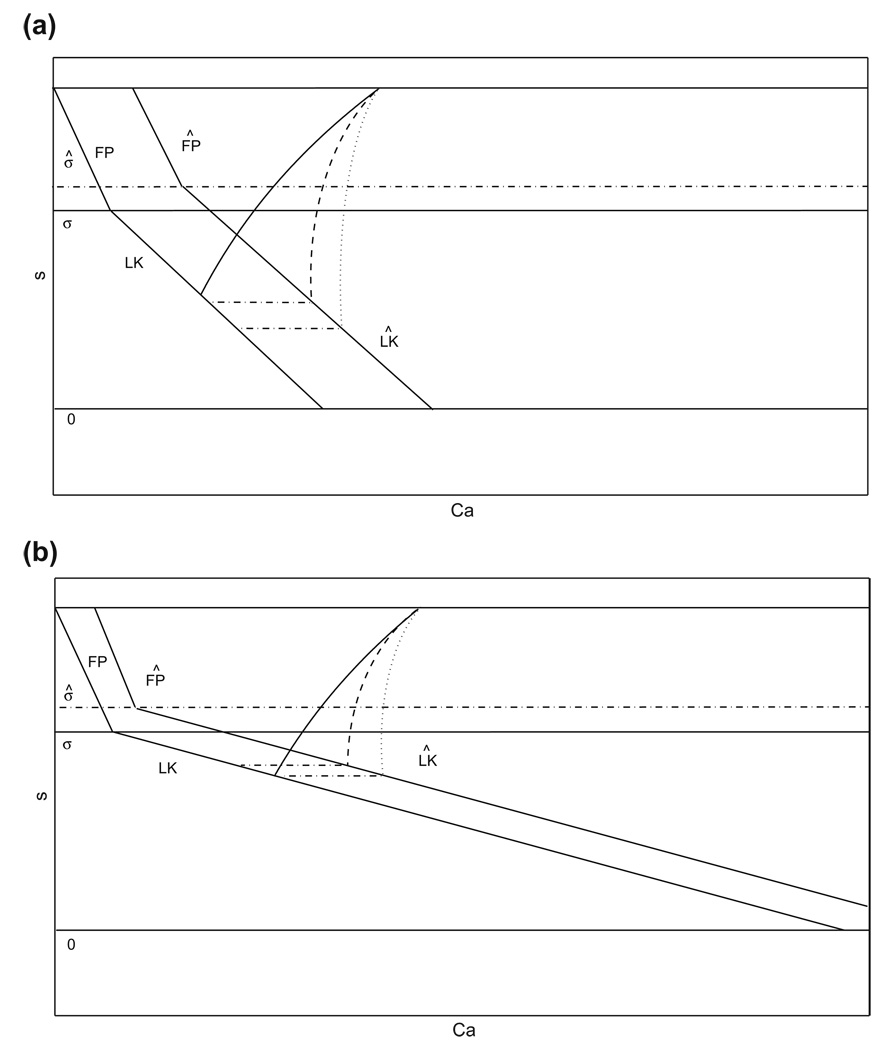
Fig. 9.
(Ca, s) phase plane for the adaptation model. The structures (curves of fixed points, FP, and left knees, LK) defined when drive is increased are labeled with the Λ symbol; σ, σ̂ denote the s values at which FP and LK intersect with baseline and increased drive, respectively. The duration of the silent phase is dependent on how Ċa and CaLK change with gapp, as well as on |∂CaLK/∂s|. (a) A small |∂CaLK/∂s| promotes a long silent phase, with relatively high sensitivity to changes in Ċa (dashed and dotted curves), seen as large changes in the s-value at which the trajectory reaches with changes in Ċa. (b) A large |∂CaLK/∂s| promotes a short silent phase, with relatively low sensitivity to changes in Ċa (dashed and dotted curves), seen as small changes in the s-value at which the trajectory reaches with changes in Ċa

