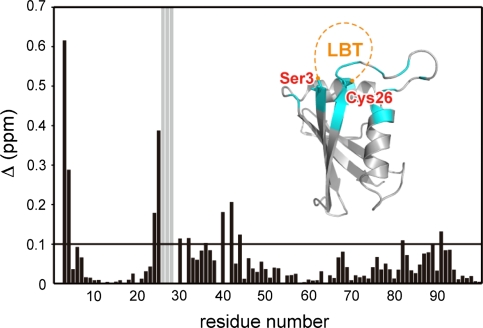
Fig. 1.
Chemical shift differences in the backbone amide groups of DR between 15N-labeled LBT-DR/unlabeled KE containing 1 eq Lu3+ and 15N-labeled DR/unlabeled KE. Δ (ppm) was defined as ((Δ1HN)2 + (Δ15N/5)2)1/2 and plotted against the residue number of DR. The residues for which the signals disappeared upon the introduction of LBT are represented as gray bars. The residues for which the signals shifted (Δ ppm > 0.1) or disappeared are mapped onto the structure of p62 PB1

