Fig. 4.
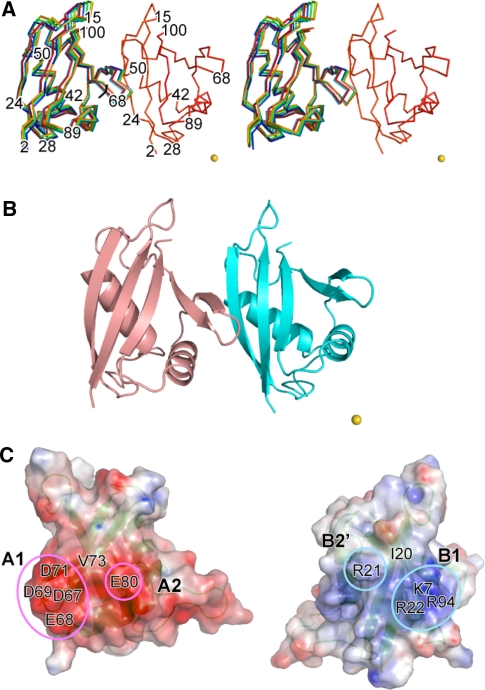
The docking structure of the DR/KE complex. a Stereo view of the ensemble of the 10 lowest energy structures of the DR/KE complex. The structures of DR are superimposed. The metal position is represented as a yellow sphere. b Ribbon representation of the lowest energy structure. c Electrostatic surface potentials of the interaction surface of the DR/KE complex are shown in an open-book style. The conserved acidic and basic regions are circled in magenta and cyan, respectively. Positive and negative surface potentials are drawn in blue and red, respectively. The structures were drawn using the PyMOL program with APBS tools (http://www.pymol.org/)

