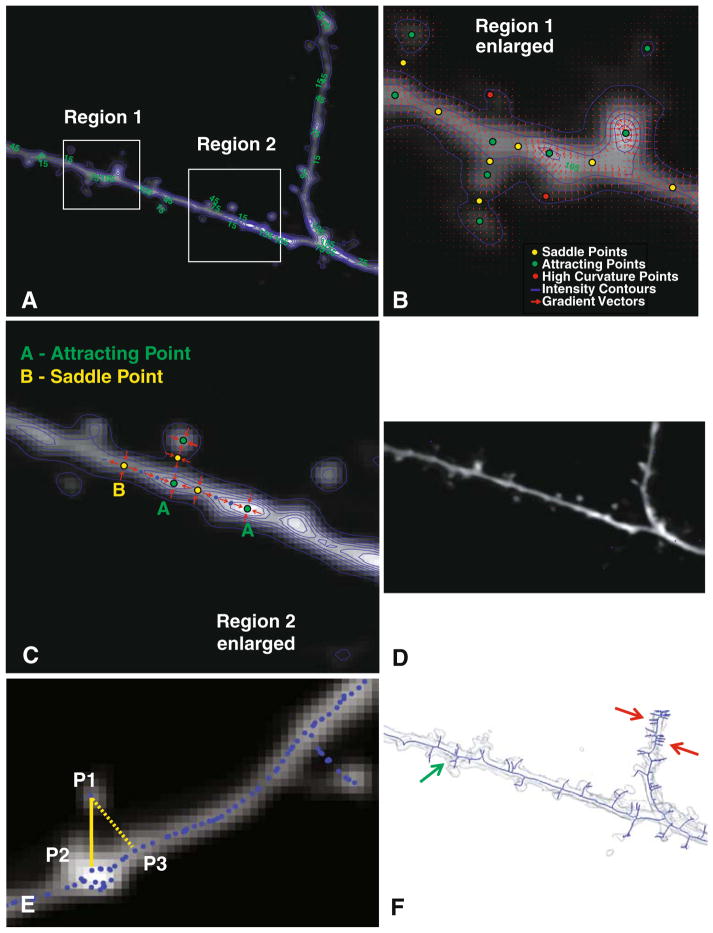
Fig. 2.
Illustrating the graph generation procedure. a Average-intensity projection of a 3-D stack overlaid with iso-intensity contours in blue. The numbers in green are intensity values. b Enlarged view of Region 1 showing the iso-intensity contours (blue), and red arrows indicating the intensity gradient vector field. Three types of critical points are also indicated in this panel. c Illustrating the procedure for path-line formation using attracting points and saddle points for an enlarged view of Region 2. Points labeled “A” are attracting points, and points labeled “B” are saddle points of the gradient vector field. Points in blue are skeleton points along paths connecting the attracting and saddle points. d The skeleton points are shown as blue dots over the full average-intensity projection image. e Illustrating the detection of detached spines using the intensity-weighted minimal spanning tree (IW-MST) algorithm. P1 is a point on the skeleton. P2 is closest to P1 in the intensity-weighted sense, whereas P3 is closest to P1 in the simple geometrical sense. f The IW-MST graph for the entire image in Panel A (in blue overlaid on an iso-surface rendering of the image data). These results are processed further

