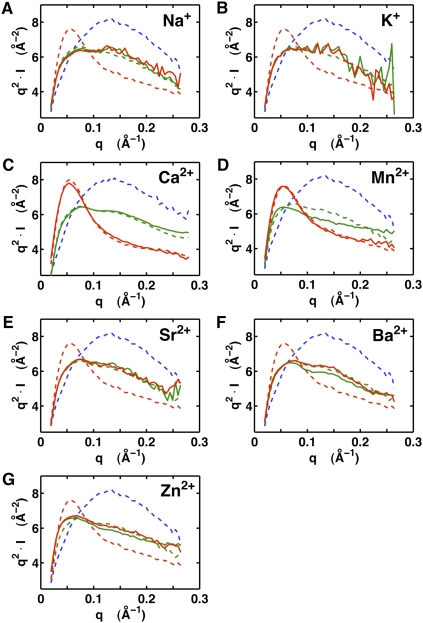
FIGURE 2.
SAXS data for the VCI-II aptamer in the presence of different ions in the absence and presence of glycine. VCI-II SAXS profiles in the presence of 2 M Na+ (A), 2 M K+ (B), 20 mM Ca2+ (C), 20 mM Mn2+ (D), 20 mM Sr2+ (E), 20 mM Ba2+ (F), and 20 mM Zn2+ (G), in the absence (green, solid lines) and presence (red, solid lines) of 20 mM glycine. For comparison, profiles in 50 mM Na-MOPS buffer only (blue, dashed lines), in the presence of 20 mM Mg2+ (green, dashed lines), and in the presence of 20 mM Mg2+ and 20 mM glycine (red, dashed lines) are shown. Data are shown in Kratky representation (q2.I as a function of q, where I is the scattering intensity and q is defined as q = 4π sin(θ)/λ, with λ being the X-ray wavelength and 2θ the total scattering angle), which is particularly sensitive to conformational changes (Lipfert et al. 2009). The lower signal-to-noise at high q (which is emphasized by the Kratky representation) noticeable in the profiles for 2 M Na+ and K+ is due to X-ray absorption and reduced scattering contrast at the high salt concentrations.

