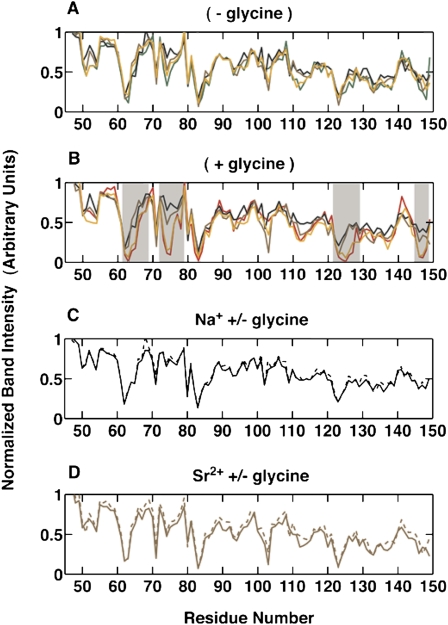
FIGURE 3.
Comparison of normalized band intensities from hydroxyl radical footprinting of 5′-radiolabeled VCI-II RNA. (A) Profiles in the absence of glycine under different ionic conditions: 100 mM Mg2+ (green); 100 mM Ca2+ (orange); 100 mM Sr2+ (brown); and 2 M Na+ (black). (B) Profiles in the presence of 10 mM glycine under different ionic conditions: 100 mM Mg2+ (red); 100 mM Ca2+ (orange); 100 mM Sr2+ (brown); and 2 M Na+ (black). (C) Profiles in 2 M Na+ in the absence (black, dashed) and presence (black, solid) of 10 mM glycine. (D) Profiles in 100 mM Sr2+ in the absence (brown, dashed) and presence (brown, solid) of 10 mM glycine. Error bars from independent gels are omitted for clarity. Regions with significant differences in the protection patterns between different ion species are shaded in B).

