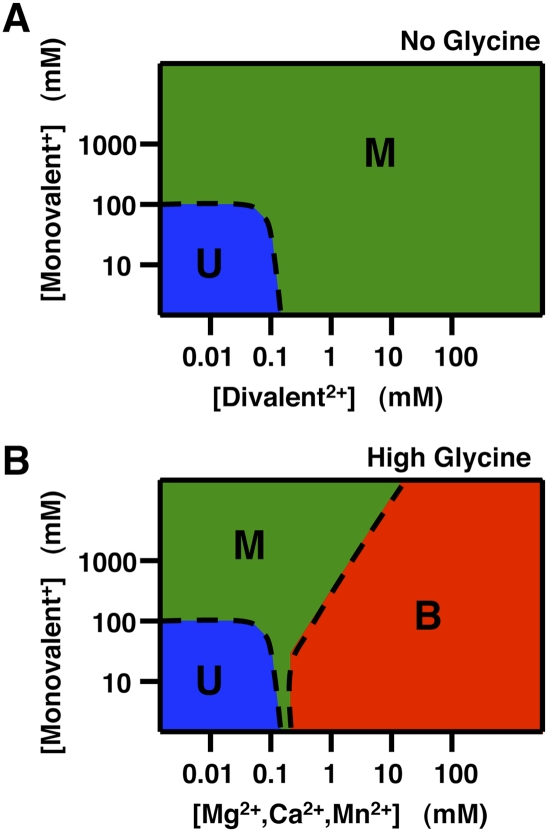
FIGURE 8.
Schematic phase diagrams for the VCI-II aptamer showing the population of the unfolded (U, blue), high salt (M, green), and glycine-bound conformations (B, red) summarizing the observed ion and ligand dependencies. Phase diagrams are shown for the absence of glycine (A) and for the presence of a high concentration of glycine (B). For divalent ions that do not support glycine binding (Sr2+, Ba2+, and Zn2+) the phase diagram in the presence of glycine is identical to that in the absence of glycine. Details of how the diagrams were constructed are given in the “Construction of phase diagrams” section in Materials and Methods.

