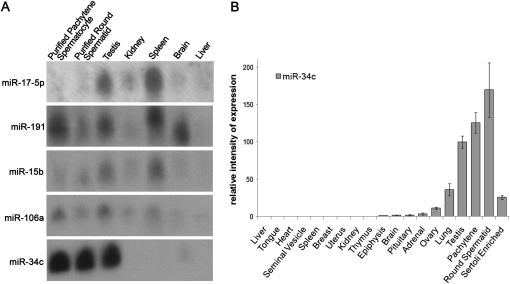
FIGURE 1.
miR-34c expression profile in different mouse tissues. (A) Northern blot analysis of miR-34c, miR-106a, miR-15b, miR-191, and miR-17-5p expression in different tissues. Thirty micrograms of total RNA were loaded in each well and hybridized with the indicated probes. (B) RT-qPCR analysis of miR-34c expression in various tissues. A value of 100 was given to the miR-34c relative expression in testis. Two different RT reactions were carried out three times and used to calculate the mean and standard error (SEM).

