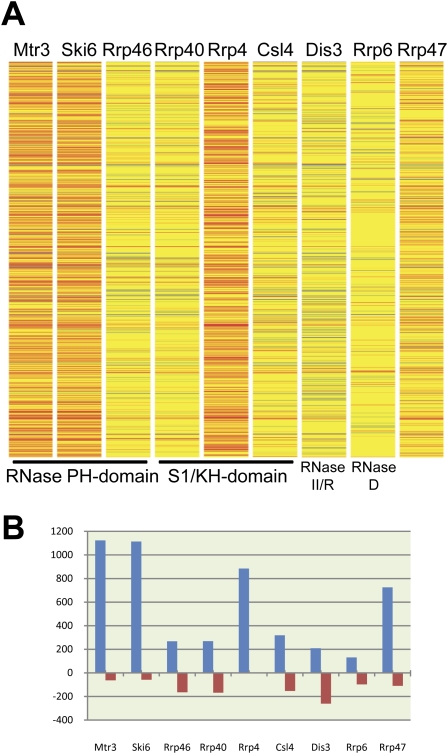
FIGURE 2.
Microarray analysis of exosome subunit depleted cells reveals distinct transcriptomic profiles. (A) Heat map showing changes in mRNA levels by subunit. Unchanged mRNAs (fold change less than ±2) are shown in yellow, decreases (≤twofold change) are shown in shades of blue, marginal increases (two- to 3.5-fold changes) in shades of orange, and finally large increases (>3.5-fold change) in shades of red. (B) The number of altered transcripts in each desMAP.

