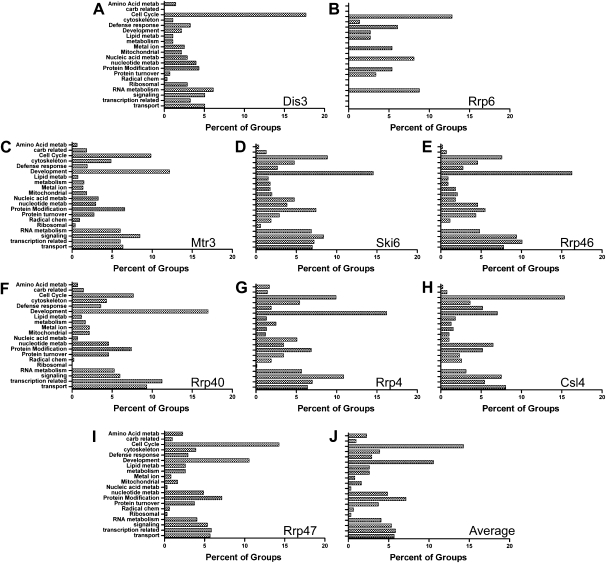
FIGURE 6.
Grouped analysis of cellular processes disrupted by transcripts increased in exosome subunit depletions. The cellular processes affected by the transcripts increased in each desMAP were identified by using Pathway Studio 5.0 (Ariadne). Pathways were grouped by similarity and patterns are shown as percentage of each group as a part of the whole profile. The patterns of (A) Dis3, (B) Rrp6, (C) Mtr3, (D) Ski6, (E) Rrp46, (F) Rrp40, (G) Rrp4, (H) Csl4, (I) Rrp47, and the (J) average pattern for all pathway groupings of increased transcripts are shown.

