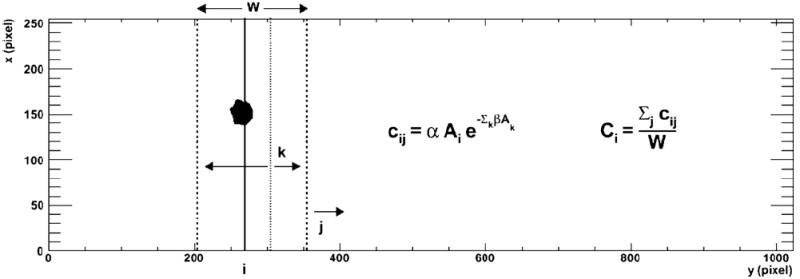
Figure 1.

The different indices i, j and k from equations (4) and (5) are illustrated against a backdrop of an imaged tumor ROI. Here i is the column number of the imaged object denoted by the solid line. For each i, the index j denotes the y-position of the leading edge of the detector, valid for all different positions where it images the ith column. The detector is indicated by the two dotted lines. For each of those j detector positions, the sum of activities in all the k columns, from j − W + 1 to j, seen by the camera is the activity that contributes to the dead-time effect.
